
According to a recent survey, many consumers fear that a housing bubble is forming. That sentiment is reasonable, given that home price appreciation is still in the double digits year over year. This market, however, is not the same as it was 15 years ago, when the housing market crashed. Here are four major differences of today’s market and the market from 2007/8.
- Houses Aren’t As Expensive As They Were During the Housing Bubble
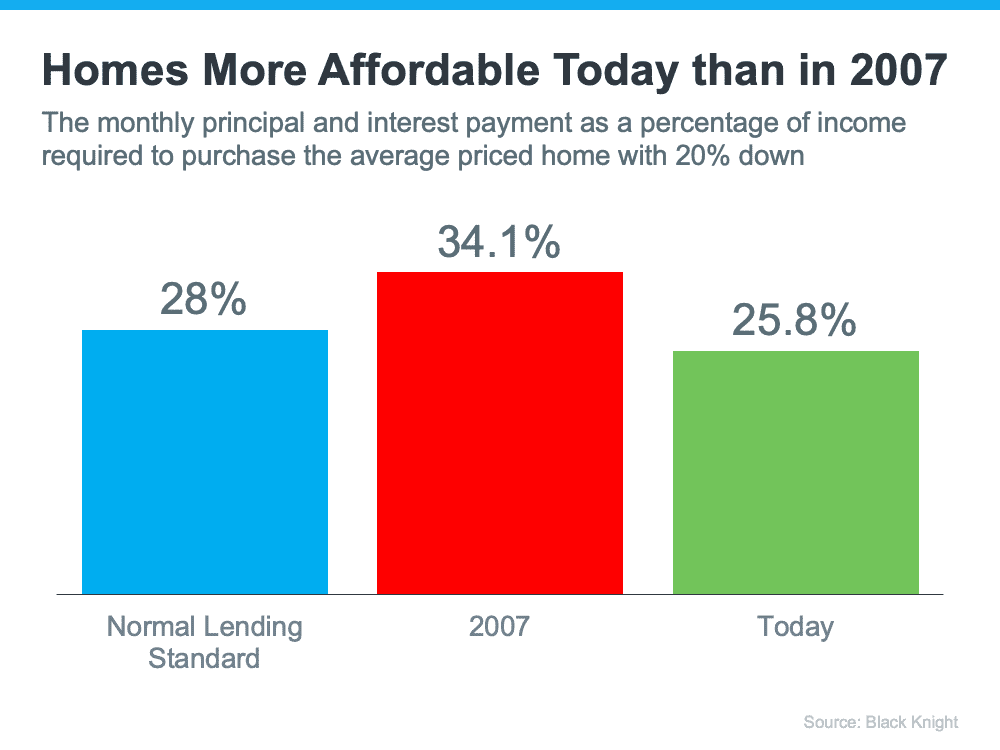
The home’s price, the buyer’s salary, and the mortgage rate available at the moment are all factors in the affordability formula. According to traditional lending guidelines, a buyer’s mortgage payment should not exceed 28 % of their gross income. 15 years ago prices were high, earnings were poor, and mortgage rates were above 6% . Prices are still high today, but wages, on the other hand, have risen, and the mortgage rate is still much below 6%, even after the current bump. Which implies today’s average buyer contributes a lower percentage of their monthly income to their mortgage payment than they did in the past. Affordability isn’t as high as it was last year, but it’s still a lot better than it was before the boom. Here’s a graph to illustrate the difference:
Getting a mortgage was lot easier during the housing bubble than it is now. Take, for example, the number of mortgages issued to buyers with credit ratings under 620. According to credit.org a credit score of 550-619 is considered low. “Due to their high credit risk, credit agencies classify consumers with credit delinquencies, account denials, and minimal credit history as subprime borrowers.” But even with a credit score so low, buyers can still get a mortgage, only they’re considered riskier borrowers. This graph depicts the amount of mortgages provided to buyers with a credit score of less than 620 during the housing boom, as well as the volume issued in the 14 years since.
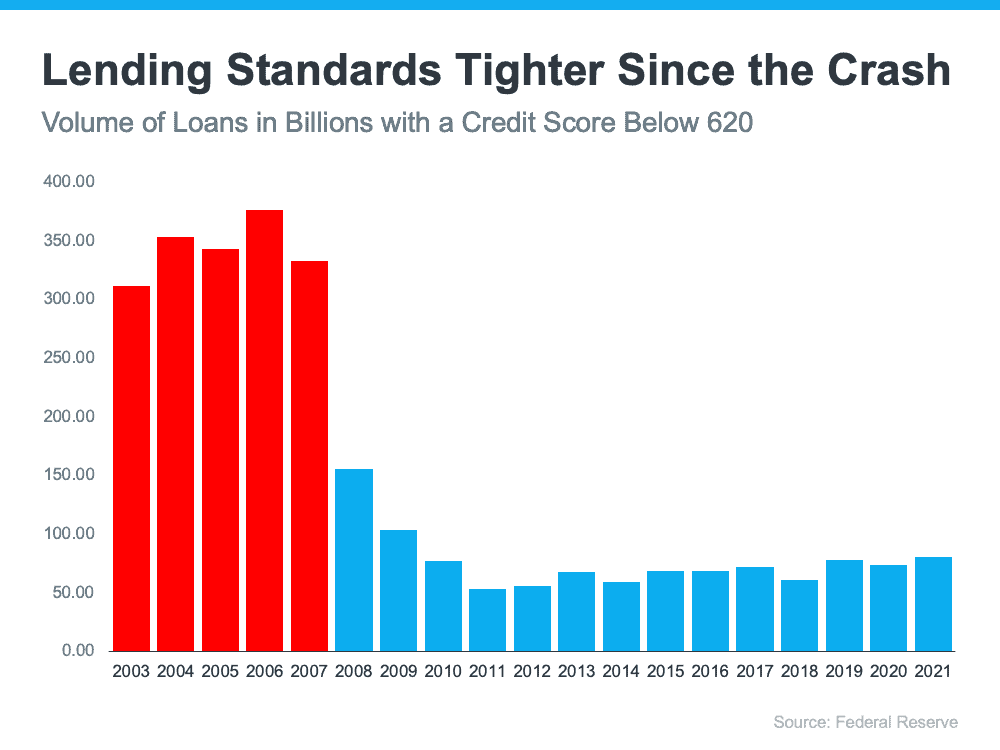
Mortgage standards are nothing like they were the last time. Purchasers that acquired a mortgage over the last decade are much more qualified. Let’s take a look at what that means going forward.
3. The Foreclosure Situation Is Nothing Like It Was During the Crash
The most obvious difference is the number of homeowners that were facing foreclosure after the housing bubble burst. The Federal Reserve issues a report showing the number of consumers with a new foreclosure notice. Here are the numbers during the crash compared to today:
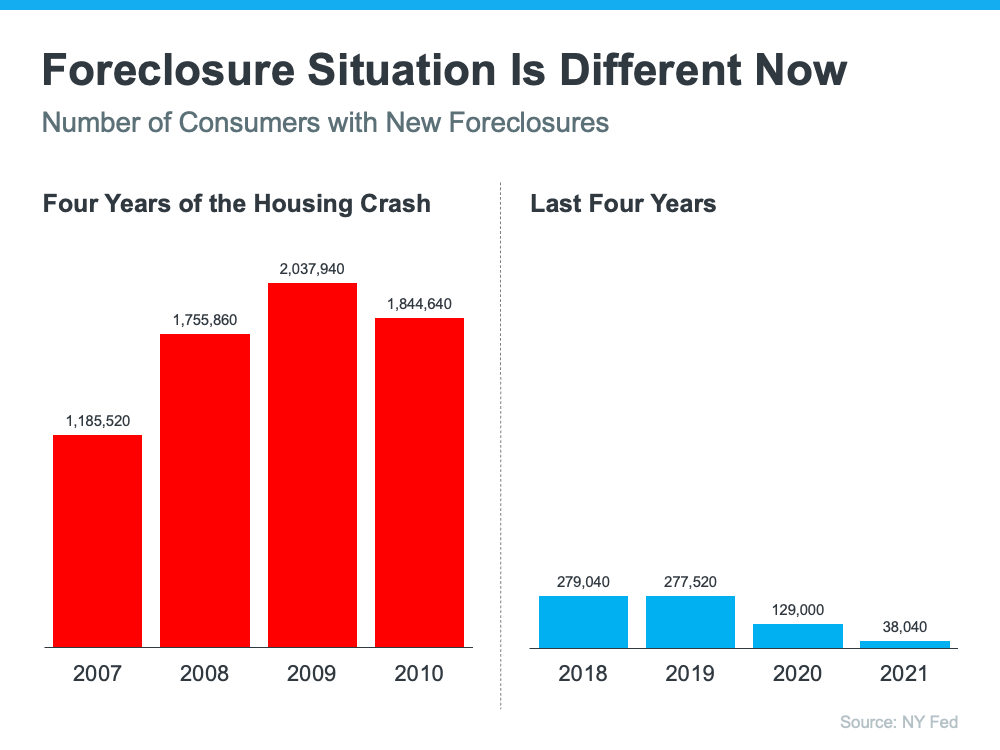
There’s no doubt the 2020 and 2021 numbers are impacted by the forbearance program, which was created to help homeowners facing uncertainty during the pandemic. However, there are fewer than 800,000 homeowners left in the program today, and most of those will be able to work out a repayment plan with their banks.Why are there so few foreclosures now? Today, homeowners are equity rich, not tapped out. In the run-up to the housing bubble, some homeowners were using their homes as personal ATM machines. Many immediately withdrew their equity once it built up. When home values began to fall, some homeowners found themselves in a negative equity situation. Where the amount they owed on their mortgage was greater than the value of their home. Some of those households decided to walk away from their homes. Which led to a rash of distressed property listings (foreclosures and short sales), which sold at huge discounts, thus lowering the value of other homes in the area.
Homeowners, however, have learned their lessons. Prices have risen nicely over the last few years, leading to over 40% of homes in the country having more than 50% equity. But owners have not been tapping into it like the last time, as evidenced by the fact that national tappable equity has increased to a record $9.9 trillion. With the average home equity now standing at $300,000, what happened last time won’t happen today.
4. We Don’t Have a Surplus of Homes on the Market – We Have a Shortage
From 2007 to 2010, there were an abundance of homes for sale (many of which were short sales and foreclosures), causing prices to plummet. Today, there is a scarcity of inventory, which is pushing property values to continue to rise.
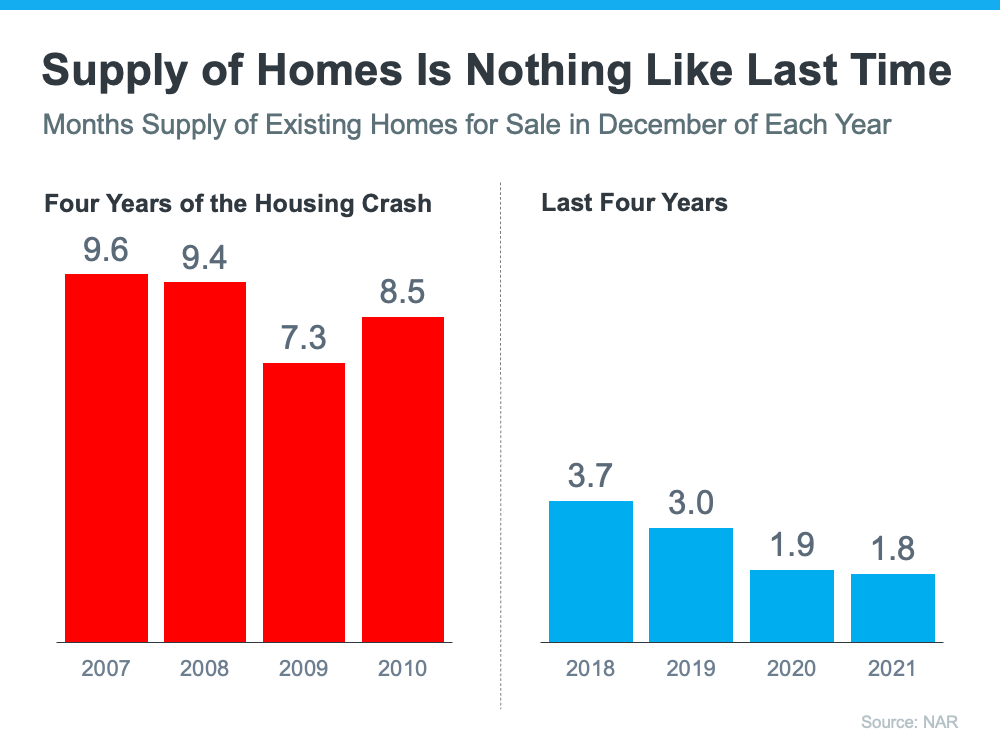
Inventory is nothing like the last time. Prices are rising because there’s a healthy demand for homeownership at the same time there’s a shortage of homes for sale.
Bottom Line
If you’re worried that we’re making the same mistakes that led to the housing crash, the graphs above show data and insights to help alleviate your concerns.